KajoData / SQL
Star schema or snowflake schema: designing a sales model
I model the same three sales lines in both layouts, separate data detail from dimension normalization and explain what to check before choosing.
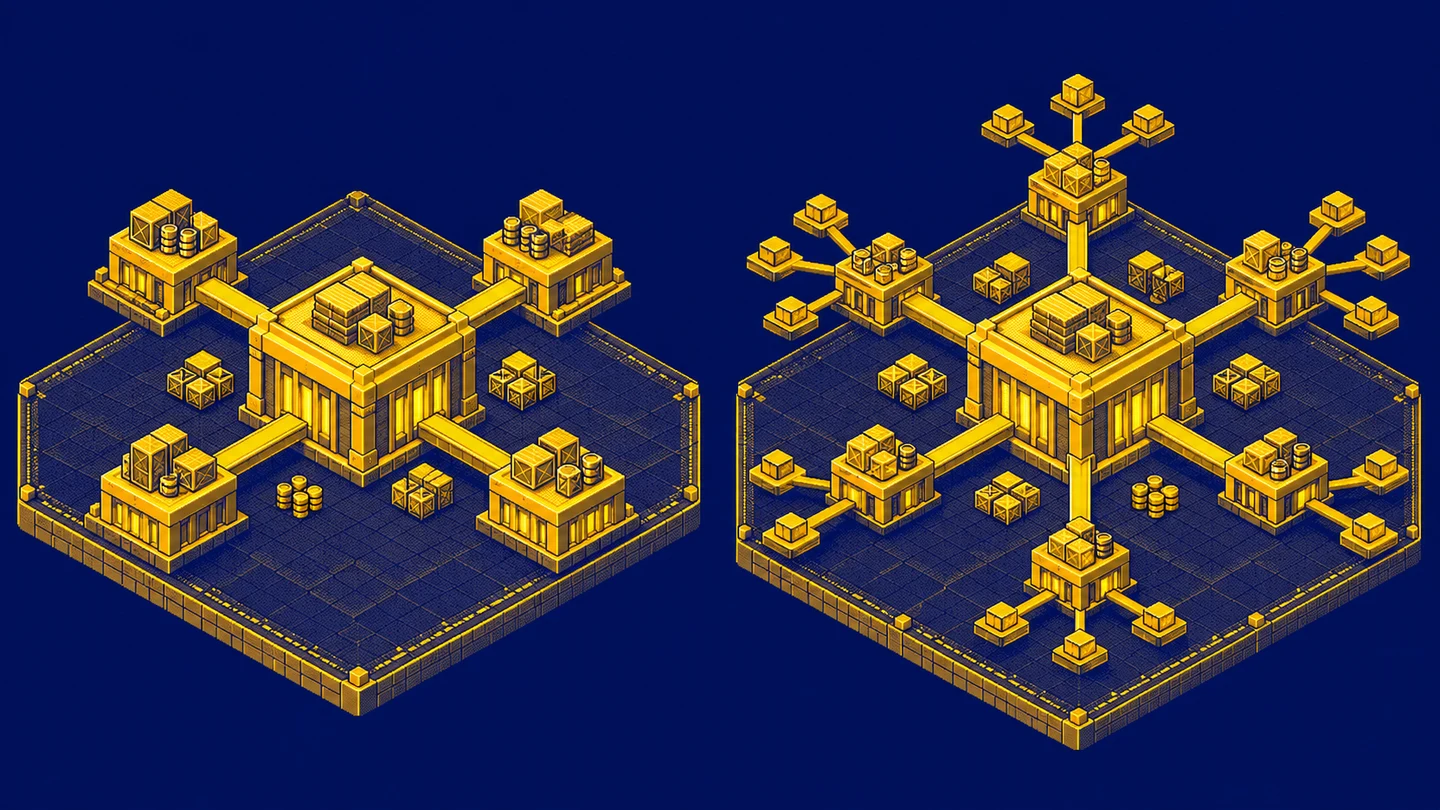
The diagram looks tidy. Sales sit in the middle, with products, customers and dates around them. Then someone moves product categories into a separate table. Have we made the model more professional, or simply harder to use?
I start by asking what one sales row represents and how the reader will analyze it. Only then do I compare star and snowflake schemas. Both can retain the same detailed events. The shape of the connections alone does not establish whether a report answers the right question.
Facts and dimensions in a simple example
A fact table stores events or measurements. A dimension describes the entities used to filter and group those events. In sales, quantity and amount can be measures, while product name, category and customer city provide descriptive context. Microsoft’s star schema introduction explains this distinction.
I do not recognize a fact merely by the presence of numbers. A customer number can be numeric, but summing customer numbers is rarely useful. Conversely, a fact recording attendance can have no separate amount: counting occurrences supplies the measure. A table’s analytical role follows its meaning rather than the data types of its columns.
The example uses a fictional shop and three order lines. All amounts are synthetic and use the same arbitrary unit. I leave out tax, currency conversion and returns to explain the model structure without hiding financial assumptions inside the numbers.
Establish the fact grain first
Grain defines what one record represents. Here it is one order line. An order can have several lines, and a product can appear in many orders. Date means the sales date. Amount is the value of the entire line, already accounting for its quantity.
For readability, I display each line as its order number and line number separated by a slash: 101/1 means order 101, line 1. Product represents product_key, units represent quantity, and amount represents sales_amount.
| Line | Product | Units | Amount |
|---|---|---|---|
| 101/1 | 10 | 2 | 100 |
| 101/2 | 20 | 1 | 80 |
| 102/1 | 10 | 1 | 50 |
Both lines of order 101 belong to customer_key 1 and date_key 20260101. The line of order 102 belongs to customer 2 and date 20260102. These date keys represent January 1 and January 2, 2026. This context stays unchanged in both model layouts.
We have three lines, two orders, four units and a total amount of 230. These numbers are useful controls for subsequent designs. If a line disappears or sales increase without another event, I investigate before judging the elegance of the diagram.
The Microsoft Fabric fact table guidance discusses grain and fact types. For our example, maintaining a consistent level is essential. I do not mix line amounts and complete order amounts in the same measure column. Adding them later would count part of the sales more than once.
Star schema: product descriptions in one dimension
In a star, the sales fact connects directly to the product dimension. One product table contains name, category and other attributes needed by the report author. Category names can repeat across products while the product key remains unique.
| product_key | product_name | category_name |
|---|---|---|
| 10 | Mug | Accessories |
| 20 | Notebook | Stationery |
| 30 | Bottle | Accessories |
Product 30 has no sales in our selected period, but it can still belong in the dimension. A dimension does not have to contain only objects with current events. It can describe the complete product offering and support comparisons between sold and unsold products.
Customer and date form other arms of the star. I do not copy all their descriptive attributes into every sales line. The fact holds keys, and the related tables supply context. A star schema therefore does not mean one enormous table repeating the full customer address beside every purchase.
Snowflake schema: category in a separate table
In a snowflake version, I move category into its own table. Product contains a category key, while the category table holds its description. The path from sales to category name now passes through product. Splitting dimension descriptions into related tables is dimension normalization.
| product_key | product_name | category_key |
|---|---|---|
| 10 | Mug | 1 |
| 20 | Notebook | 2 |
| 30 | Bottle | 1 |
| category_key | category_name |
|---|---|
| 1 | Accessories |
| 2 | Stationery |
Sales still contains precisely the same three lines and total of 230. Extracting category has not created transactions or removed detail. It changes where the attributes live and how the analysis reaches them.
Distinguish a snowflake schema from Snowflake the data platform. This modeling pattern can be implemented in different systems. Using a particular platform does not force the snowflake layout, just as naming a table “star” cannot guarantee correct relationships.
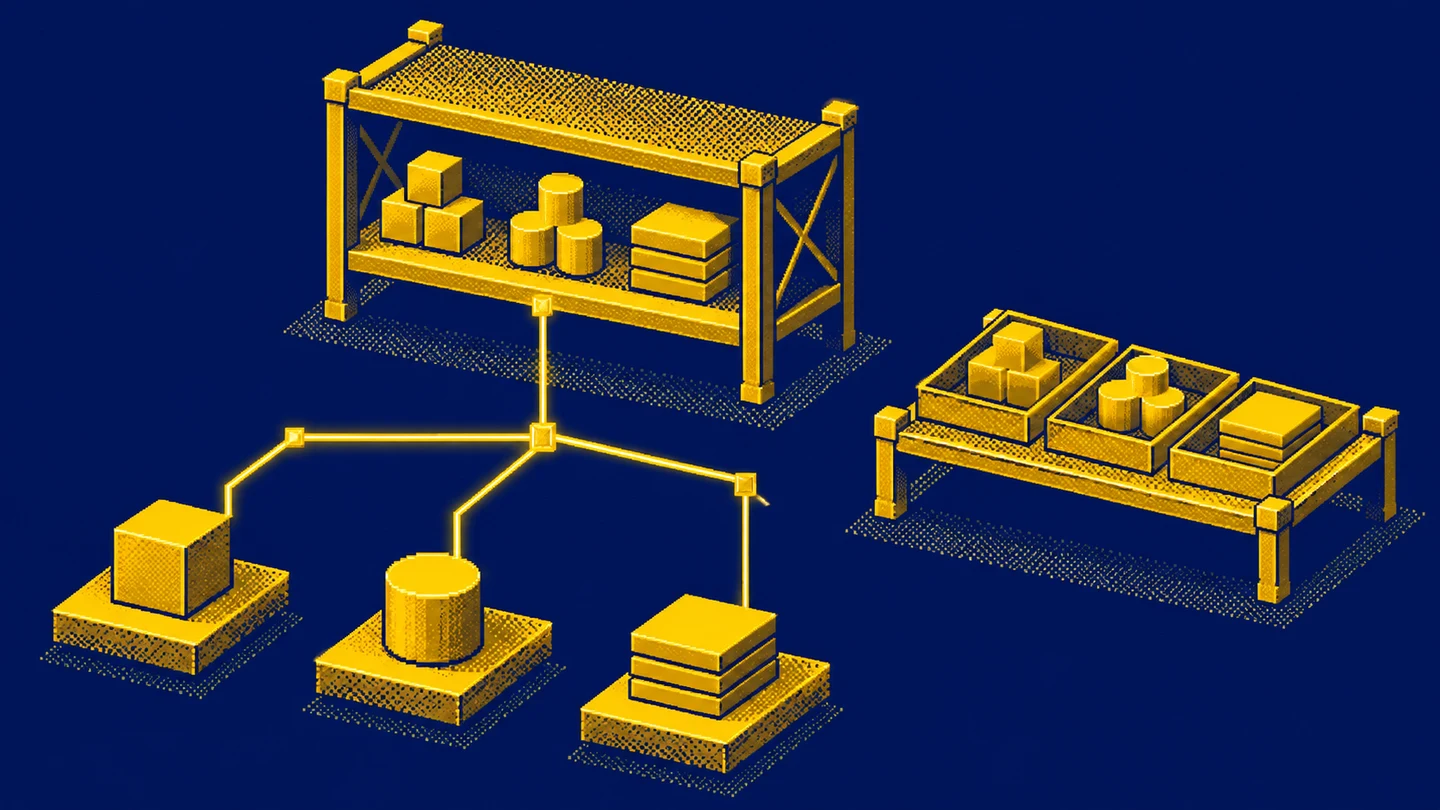
An absent sales line does not automatically constitute a measured zero. For a product without events, decide whether the report displays zero, a blank value or no row. This is a presentation and population-completeness rule to document independently of dimension layout.
The same report in both layouts
The question is sales by category. In the star, I connect sales to product and group by its category attribute. The snowflake adds a step from product to the category table. I assume one match on each descriptive side of these relationships.
Accessories receives product 10’s sales of 100 and 50, totaling 150. Stationery receives 80. Bottle contributes no sales because there is no Bottle line in the fact table. Both correctly related models produce the same category amounts, 150 and 80.
This is a useful example for a conversation with a report recipient. It shows that moving category preserves both the answer and the detail. If the reader needs the order identifier and exact line, both models still contain them. Normalizing a dimension does not automatically introduce finer events.
Repeated descriptions versus repeated keys
The star contains Accessories beside two products. This is an expected repetition of an attribute. A repeated product_key 10 without an appropriate versioning rule is a different issue. A join can then match the same sales line to two product rows.
Suppose product 10 accidentally has two matches. Its sales amount of 150 appears twice after joining, while product 20 still contributes 80. The overall total rises to 380. This is a relationship correctness problem. Calling the design a star or snowflake does not repair it.
A similar mistake can occur in the category table of a snowflake. If category keys are ambiguous, that extra join can duplicate contributions. I therefore inspect key uniqueness and missing matches at every step of the path. More tables mean more relationship boundaries that need to be understood.
When integrating several sources, I would establish the scope of key uniqueness too. Product 10 in store A and product 10 in store B can mean entirely different items. Moving both numbers into one column without identifying their source risks assigning incorrect descriptions and amounts. A surrogate key helps represent a recognized object in the model, but loading must establish which object it belongs to. Merely generating successive numbers does not solve matching between systems. That is a separate decision from extracting the category table.
Category history is a separate decision
Imagine moving Mug to a different category in February. Should January sales be displayed under today’s classification or the category that applied when the sale occurred? Both needs exist, but the policy must be explicit. A separate category table does not automatically record history.
Overwriting a dimension description corresponds to SCD type 1. Creating successive dimension versions corresponds to type 2. The dimension modeling documentation explains surrogate keys and version validity periods. Versioning must cooperate with fact loading so that an event references the appropriate context.
For our shop, I would record the requirement before selecting the layout: historical reports preserve the category valid on the sales date. Then I would inspect a January purchase and a February purchase of the same product. If both receive today’s category, the model fails that requirement even when every technical join succeeds.
A Power BI model and a warehouse model
The layer that stores and prepares data does not have to look exactly like the layer exposed to report authors. You can maintain separate source tables while supplying one convenient product dimension to the semantic model. That does not require pretending that the original source used a different structure.
The Power BI guidance explains why combining dimension tables can improve usability and shorten filter paths. The appropriate choice still depends on data and requirements. This is guidance for an analytical layer, rather than proof that normalization is wrong in every system.
I also consider the person building a visualization. Can they find category, product name and sales amount? Do they understand which date they are selecting? A model that requires guessing whenever a field is dragged into a visual transfers the cost of a technical decision into the user’s daily work.
Performance and storage need a concrete comparison
A separate category table reduces repetition of its description. It also introduces keys and relationships. The storage balance depends on row counts, attribute widths and storage mechanisms. It cannot honestly be calculated from the diagram alone, particularly when an engine compresses repeating text.
Extra joins can mean more work, but their actual cost depends on the engine and queries. I am not claiming a percentage advantage for either model. A design with an appropriate grain can also answer different questions from one that stores more expensive detail, making casual speed comparisons misleading.
I would compare the same questions over the same events: sales by category, filtering one product and monthly totals. Refresh time and maintenance effort belong in the comparison too. Opening an empty report quickly is not sufficient evidence about the performance of the complete solution.
Several facts and many-to-many relationships
A larger model can contain line-level sales, monthly targets and daily stock snapshots. These facts have different grains. I do not join a monthly target directly to every sales line just because both tables have a product code. That can repeat the target many times.
Shared dimensions help analyze several facts in a coherent context. You still need to respect the level at which a measure exists. A monthly product target does not become a daily customer target merely because two filters are added. That would require a separate allocation rule, explicitly named and agreed.
If a product belongs to several categories simultaneously, our simple one-category example is no longer sufficient. Microsoft’s many-to-many guidance discusses bridge tables. Decide whether each category shows the full sales amount or an allocated share. The sum across categories can then need a different interpretation from the one in our example.
Filter direction does not follow from a tidy diagram
In Power BI, relationships also determine how filters propagate. A category selection must actually travel through product to the relevant fact measure. Drawing the connections is not proof that this works. I would select Accessories and expect 150, then select Stationery and expect 80.
I would not enable every filter direction simply because one chart fails to respond. Microsoft recommends minimizing bidirectional relationships, because they can complicate model behavior. Inspect the current path first and establish whether each table plays its intended role.
A useful check also clears the filters. The result should return to 230 when no other scope conditions apply. The recipient needs predictable movement between the total and its detail. An accidental collection of relationships can produce one convincing screen and another misleading one.
How I choose the layout
For a straightforward reporting model, I would start with a star and readable dimensions. I would consider separate dimension tables when there is a concrete need to share, maintain or process them independently. I would record the benefit and the cost of the extra path. Merely wanting fewer repeated words is a weak requirement.
I would also separate the semantic-model decision from rebuilding a source. Sometimes a convenient reporting view is enough. Sometimes the loading process and historical handling need to change. Those are different scopes of work even when both end with a similar rectangle labeled product dimension.
When handing the model over, I would document the grain of every fact, dimension keys, history policy and amount definitions. This helps the next analyst more than a label saying “optimized model.” It also provides a basis for deciding whether a new attribute can safely join an existing dimension.
Correct relationships do not choose the aggregation
In our example, quantity means units and sales_amount is the value of an entire line. I can add the three line amounts because they describe the same kind of value in the same unit. If I stored unit price instead, quantity would need to be included. Two units priced at 50 make 100 of sales, rather than 50.
I would not add unit prices simply because they are numeric columns in a fact table. A margin percentage is also unsuitable for straightforward addition across lines. First I need numerator and denominator definitions and the appropriate aggregation rules. Choosing a star or snowflake does not remove responsibility for the meaning of a measure.
Order counting deserves the same care. Three fact records mean three lines. There are two orders. A report that labels a row count as an order count will be wrong in both designs. Discussing the schema should include actual analytical questions, rather than ending when everyone agrees which table contains category.
What I check when changing an existing model
When moving category, I would preserve a small set of expected answers: three lines, two orders, four units, sales of 230, and the category split of 150 and 80. Agreement on the overall total alone is insufficient. Opposite errors can cancel out, while one category loses sales to another.
I would also compare a product without sales, a missing match and a category change over time. These cases expose assumptions hidden by an ideal diagram. I record which events should remain and how they should be labeled. This distinguishes an intentional missing-data policy from accidental data loss after another join.
Finally, I would check that the fields selected by report authors still mean the same thing. A technical redesign can move category, leave an obsolete field behind or create two similar labels. A complete change includes clear names and an unambiguous current field set. Users should be able to repeat their previous question without studying the history of the redesign.
Exercise: a product without a category
Add a sale for a product that is not yet in the dimension. What should a reader see: an uncategorized row, a special missing category or an event rejected into a quality report? Describe the expected result and how its amount is retained. Do not let an INNER JOIN silently choose the missing-data policy.
Then add a new category assignment for Bottle, which still has no sales. Check that you understand the difference between the product catalog and the event population. Both contain useful information, but the existence of a product does not create a sales amount.
To practice join behavior, continue with INNER JOIN and LEFT JOIN. Both model layouts rely on the same foundations: key meaning, match counts and checking what happened to the amounts after a join.
Key takeaways
Does a snowflake schema provide more detailed data than a star schema?
The layout alone does not determine detail. Fact grain depends on what one row represents. Both designs can retain the same sales lines.
Must a star schema have only one fact table?
A single star is usually illustrated around one fact table. A larger model can contain several facts with shared dimensions and different grains.
Is a snowflake schema always slower?
Extra joins can increase work, but performance depends on the engine, data, storage and queries. A diagram is not a performance measurement.
AI was used in an automated way while working on this article. If you want to learn how to do it too, check out this project.